Installing the Debugger within a remote server environment
Within the WebMaker Studio the Debugger is integrated and available via the Test Settings and Publish Settings menu options. In order to use the Debugger and its server configuration, logging and debugging capabilities within a remote test or production environment, the Debugger needs to be installed locally on the server environment.
A WAR file for deployment on J2EE Servers is available and included as dashboard.warA download and accompanying installation instructions are available on the WebMaker Forum. Once the WAR has been installed on the server, The Debugger can be started by using the following URL:
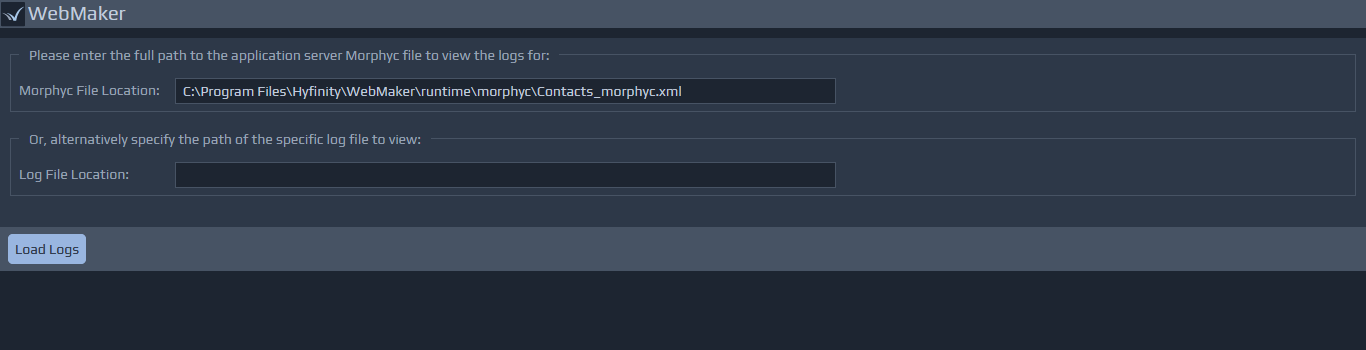
{deployment_location}/Dashboard/dashboard.do. The entry screen enables the ability to open a server configuration file (morphyc file), which contains details for the log files required by the Debugger. It is also possible to link to a specific log file directly. The first option allows the logs to be viewed and the application configuration to be adjusted. The latter only allows the logs to be viewed. The path entered for either option should be the location of the file on the server, where the Debugger is installed.
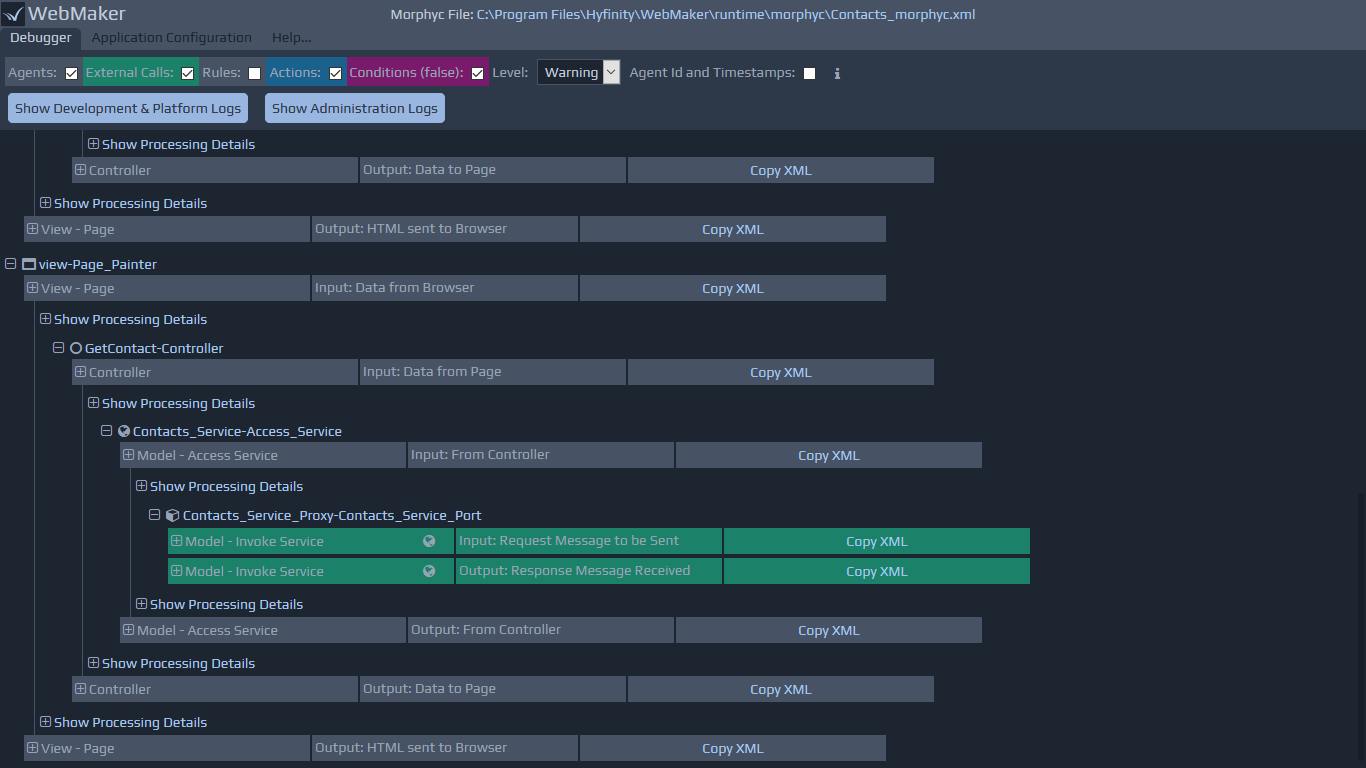
 The first tab covers the Debugger log details that is similar to the Debugger tab in the Studio. In the server installation, after a morphyc file has been selected, additional buttons are available for different types of logs. These are usually the developer and platform logs (as seen in the Studio), along with a separate button for the administration logs. By default, the developer and platform logs are shown.
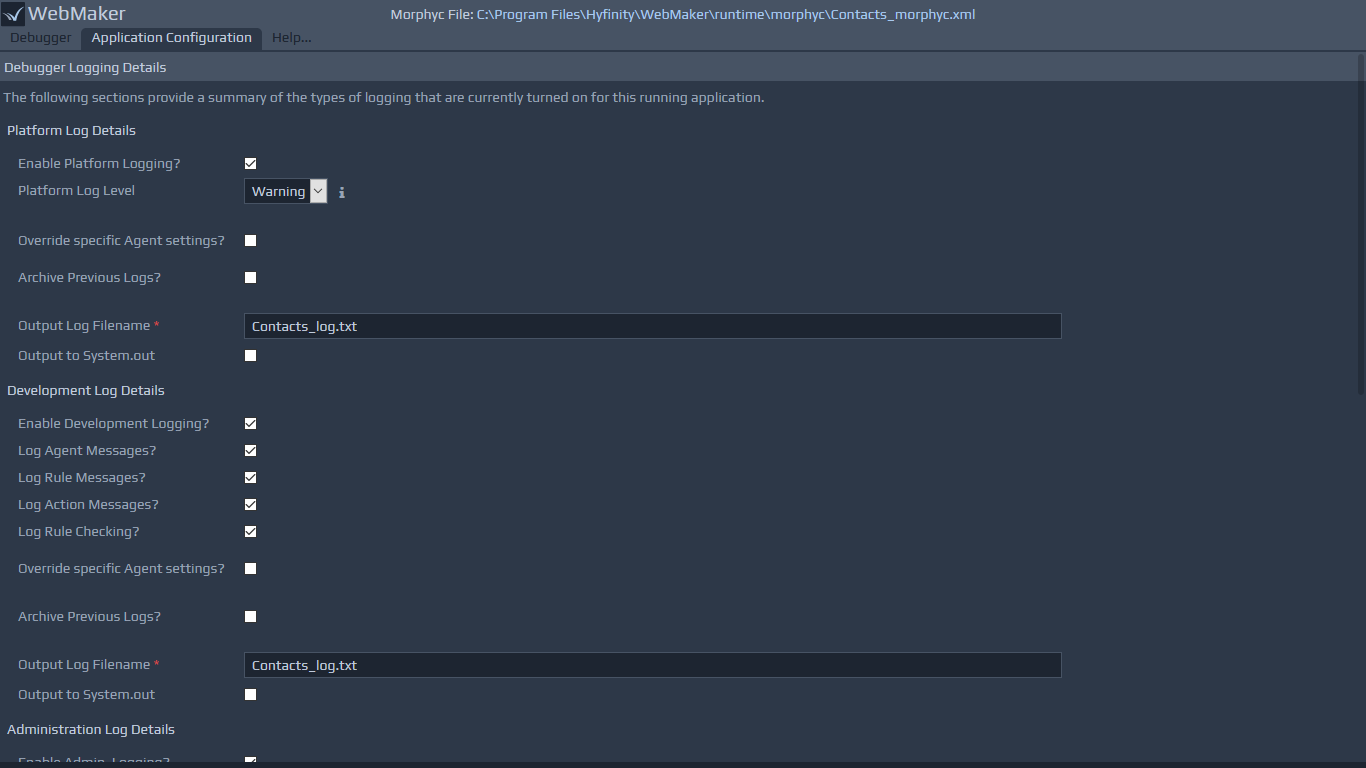
 The second tab lists the Application Configuration options, and is only available if a morphyc file has been selected. This provides similar settings as found in the Studio within the Publish Settings menu option, with the server version only providing options for the runtime aspects, including details of the logs and the platform optimisation settings. Some additional details on some of these aspects is available in the following sections: