 Test Settings:
Location Details - Where the application is actually deployed on the local machine.
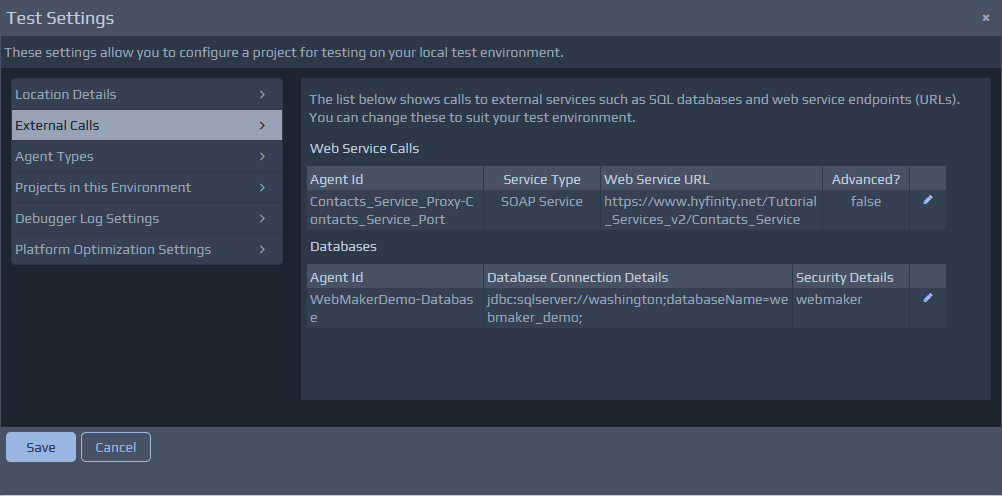
External Calls - Shows calls to external services such as SQL databases and web service endpoints (URLs). You can change these to suit your test environment if required.
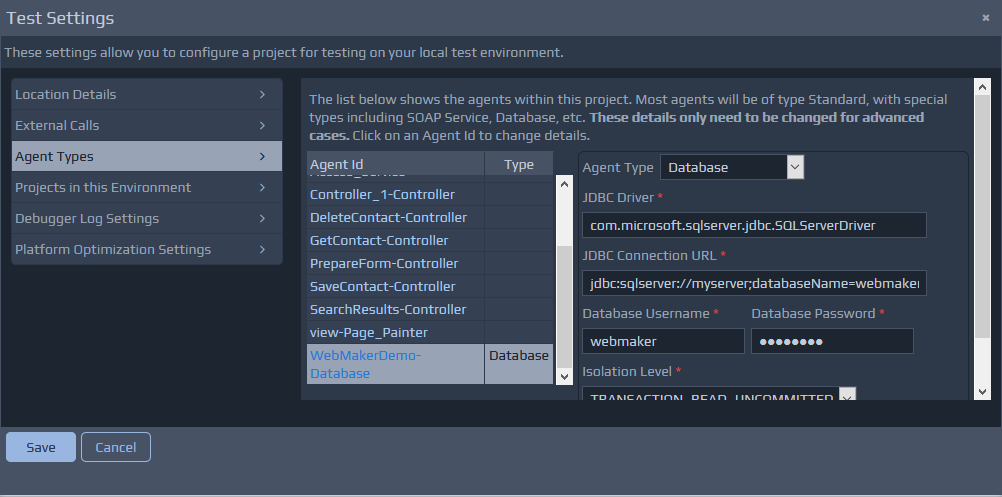
Agent Types - Shows the various Agents within an application project. Most Agents will be of type
Standard, with special types including
Soap Service,
Http Service,
Database, etc. These details only need to be changed for advanced cases. Projects in this Environment - Shows all the projects that are currently in this test environment. The list will be updated when you press Run Test, and also when other projects are configured to use the same test environment. This is useful when multiple projects are combined to form a single application. In most cases you will only see details of the current Project. Debugger Logging Details - These details control the level of logging that will be produced by the running application within the test environment. These logs are used by the Debugger to show the application flow and rules processing. Platform Optimisation Details - The Platform Run Mode, Pooling options for concurrency, scalability and resource management.
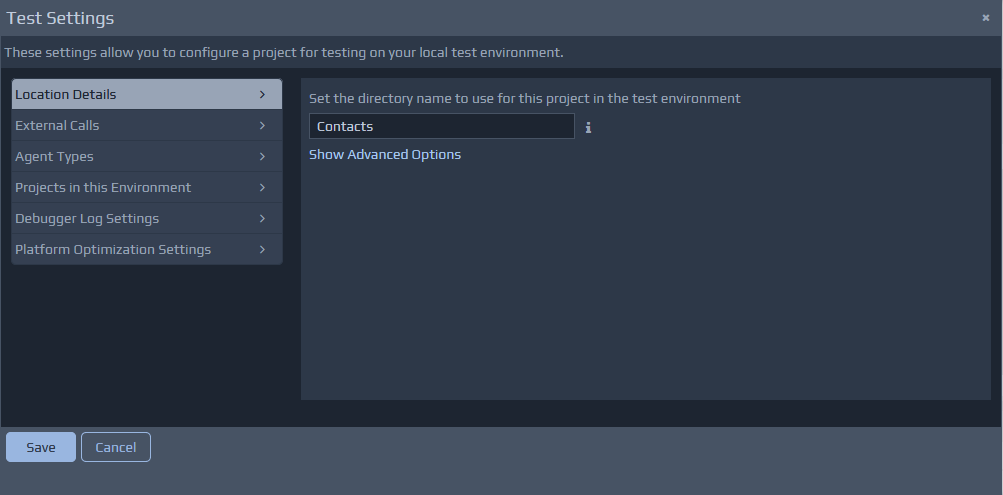
Location Details
The location details define where the test environment is located for a particular application. These settings should not require modification in most scenarios. They will require changes if multiple projects are to be combined into a single application.
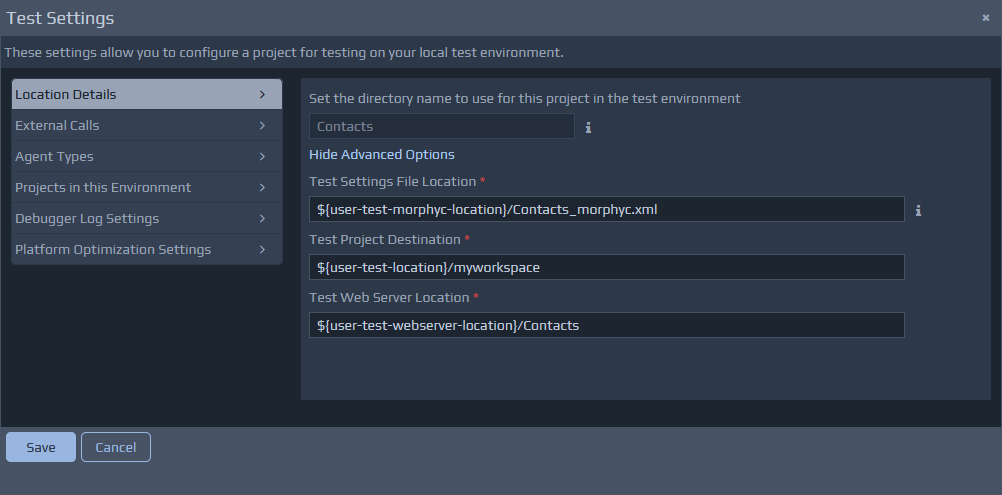
Project Directory Name - By default you will only see a directory name, representing the location where your project is deployed. This directory is relative to the web server location and will typically reside within the webapp folder. You can use the Advanced Options link to reveal more detailed settings that are set for you based on the Project Directory Name you select for your deployment. Within Advanced Options you should see the following settings:
Test Settings File Location defines where the _morphyc.xml file will be located, which is the configuration file that holds the runtime test environment details such as log settings, platform optimisation details, etc.
Test Project Destination defines where the location of the runtime files that constitute the runtime application. This will contain all the meta-data files required for the application, including all the Controller definitions, Pages and Rules. This collection of files that forms the specification for the project is often referred to as the application blueprint.
Test Web Server Location defines where the web application elements will be located in the test environment. This is used to define where the Run Test operation will place the CSS files, JavaScript files, images, etc.
External Calls
The External Calls section will show details of any external resource that will be called from the application. These details will include SQL databases, web services, inter-project calls, etc. These details are generally created in projects when Data Sources are used on the Page Design screen.
A Run Test operation is required for any changes made on this screen to take effect.
 The sections that will be displayed include:
Databases - Shows the connection information for each SQL Database Connection (JDBC driver, connection URL, etc). You can also edit these settings from the
Database Selectionpopup, available in the Page Design and Rules Design tabs. Web Service Calls - Shows the endpoint URLs in use for each web service proxy, which can be modified as required. The Advanced Features option enables the processing of an additional HttpHeader fragment in the rules, which can contain information about the method of interaction and security details (if any) for remote services. Inter-Project Calls - Shows the proxies for the target controllers in external projects that can be called by controllers in this project. For example, there may be a common Controller that is located in a shared project. This section allows you to adjust the target controller that will be called by each proxy. See Managing Multi-Project Applications for additional details.
Agent Types
The list on the left hand side shows the controllers that already exist within the project. Most controllers are of type Standard(shown as blank in the list). Special Agent Types will be shown such as
SOAP Service,
Http Service,
Database,
Inter-Project Proxy, etc. These details only need to be changed for advanced cases. If changes are required, click on an Agent Id link to show the current details for the Agent on the right hand side. These details can be changed as needed. Firstly, select a different Agent Type and then record the appropriate details. Changes must be saved using the Change Agent Type button, and the Test Settings dialogue should be closed to allow synchronisation of various platform settings. The Test Settings dialogue can be opened again if required.
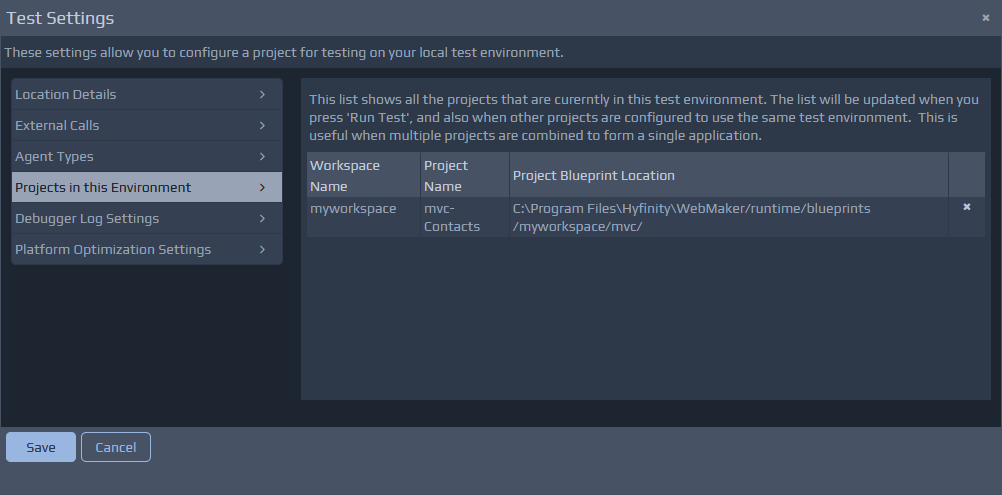
Projects in this Environment
This section shows details of the projects that are included and constitute this application. Most applications will only consist of a single project. This screen provides the ability to remove entries, but in most cases you will not need to change these details.
Please see the section on Managing Multi-Project Applications for more details.
Debugger Log Settings
WebMaker logs are split into three parts, the Platform, Development, and Administration logs. The Enable ... Logging? tick box can be used to enable or disable each type of log. If enabled then the resulting logs can be viewed on the View Debugger tab and additional options are available.
Platform Log Details
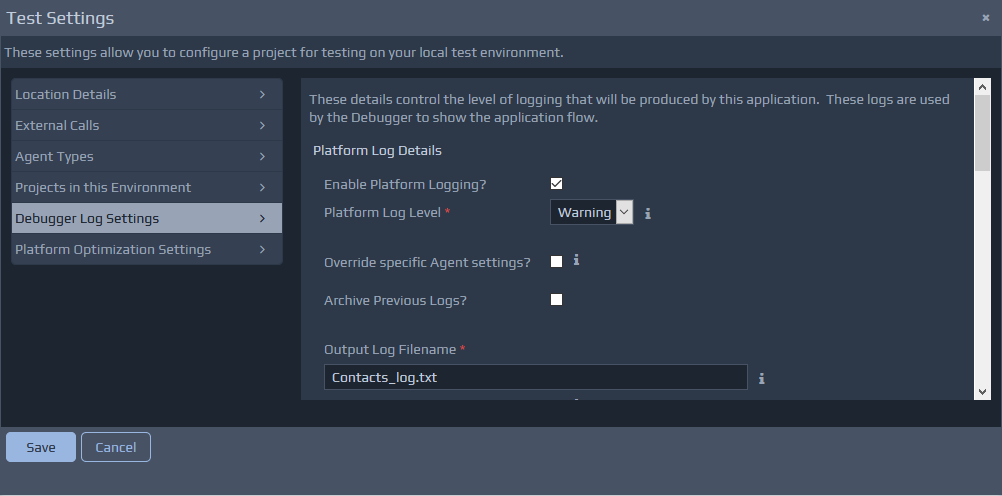 Platform Log Level:
Fatal - Only log critical errors that prevent the on-going operation of the application, e.g. unavailability of soap service or database connection.
Error - A significant error, which can be resolved by further attempts or the application logic handles the error and is able to make a decision to bypass the error, to enable the application to continue. E.g. An instance of a Java method call failure may be an error, but the non-existence of the method may be fatal.
Warning - Potentially a problem that may need to be addressed, but does not affect the fundamental operation of the application. E.g. failure to bind a field.
Info and Debug - Most verbose forms of logging, providing detailed diagnostics during runtime execution or development.
Override specific Agent settings? - For the platform and development logging types it is possible to override the settings on a per Agent basis. This is done by ticking the Override specific Agent settings? and adding details of the Agent for which overrides are required. The Agent ID values that need to be entered here can be found on the View Debugger tab. The ID does not need to be a full value (isolating a specific Agent) and can be used to apply settings to a wider collection of Agents. For example, if you don't want to log anything from the Example project as a whole (in a multi-project application configuration for example), you could just enter mvc-Examplein the Agent ID field, and set the rest of the options accordingly. The override settings will be applied to any agent whose full Agent ID starts with the entered ID value. This log overriding functionality is very useful for more complex applications where you would otherwise generate very large log files. You can use this capability to filter the logs to just the ones you are interested in, making the resulting files smaller and easier to view and process. It also allows the log levels to differ for some Agents. So, you may wish to only produce
Errorlogs for some project Agents. Archive Previous Logs? - If enabled, you need to set the Max Backup Index and Max File Size values. The max backup index attribute indicates the number of rolling archive files to keep and the max file size indicates the maximum size of the log file before it is archived. The max_file_size parameter is stated in bytes, e.g.
1048576 = 1MB. If the archive previous log is not set then only one log file will be created. By default, this is not set. Output Log Filename - Name of the file where the logs will be written. The log destination can be set to the same filename for each logging type. This will result in all the logs being output to the same file. Output to System.out - This option indicates whether logs will also be output to the tomcat runtime screen.
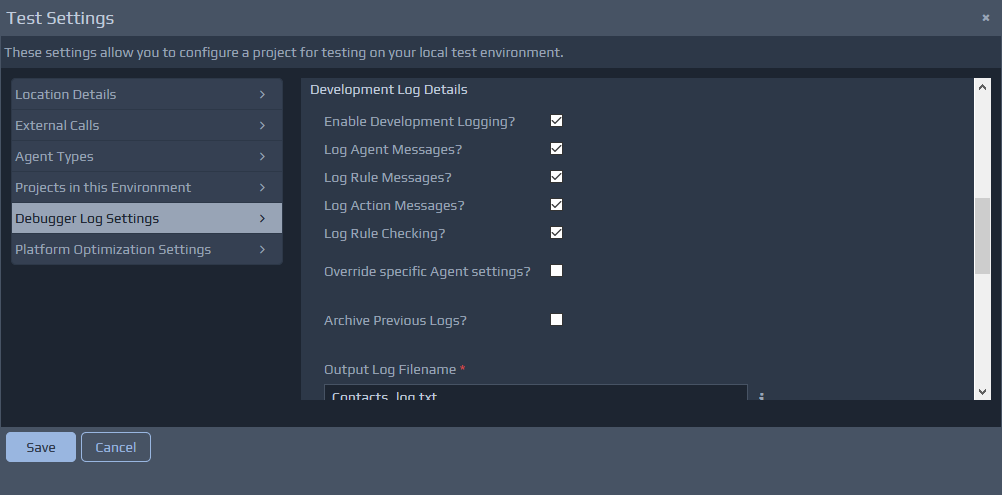
Development Log Details
These logs mainly focus on the XML messages flowing through the application. Different aspects of development logging that can be controlled independently. Agent Messages covers the information flowing between each Agent (incoming and outgoing), Rule Messages detail the state of the FactBase and any Variables before each rule is fired, Action Messages detail the state of the FactBase and any Variables after each action is fired, and Rule Checking Messages indicate when each rule is being checked to see if the conditions are trueand whether the rule should be fired. The other field options Override..., Archive... and Output ... work in the same manner as those settings previously defined in the Platform Log Details above.
Administration Log Details
Administration logs contain details on session and caching activities performed by the underlying platform. These logs also capture details of the project assets that are cached by the platform.
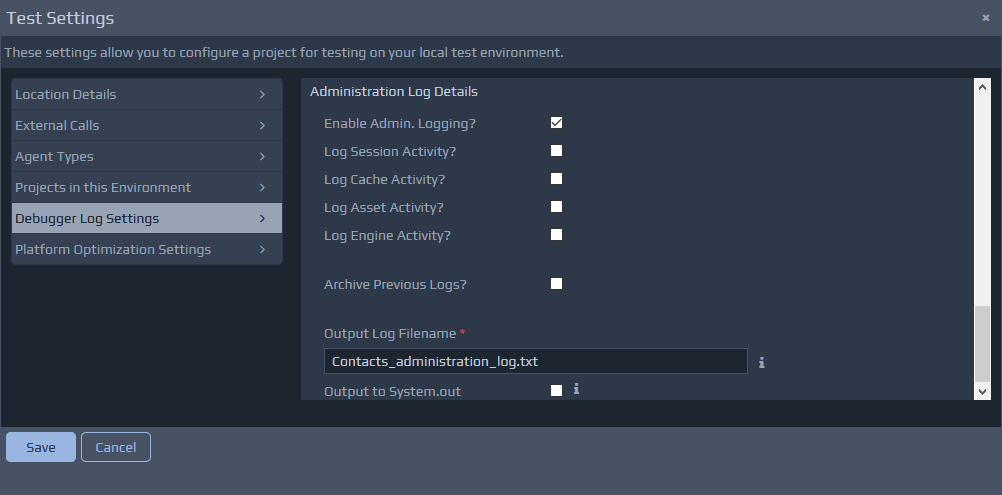
Log Session Activity? - An entry is created for each Agent Session created or destroyed for a user using an application.
Log Cache Activity? - Entries are created for used-defined cache operations within the rules, for
The other field options Archive... and Output ... work in the same manner as those settings previously defined in the Platform Log Details above.
Sessionand
Applicationlevel settings. Log Asset Activity? - An entry is created for platform-level assets such as XSL transformations. How and when such assets are cached is determined by the Run Mode setting. The key difference between this and the Log Cache Activity setting, is that this setting applies to assets that form the specification of the application and the former setting applies to an application being developed on the platform. Log Engine Activity? - An entry is created for each Agent Engine that is created and pooled for use. This option is impacted by the Platform Optimisation Settings related to pooling.
Platform Optimisation Details
Normally, you should not need to make changes in this area during development. This are more applicable and useful within the publication settings, when publishing a project for your production server.
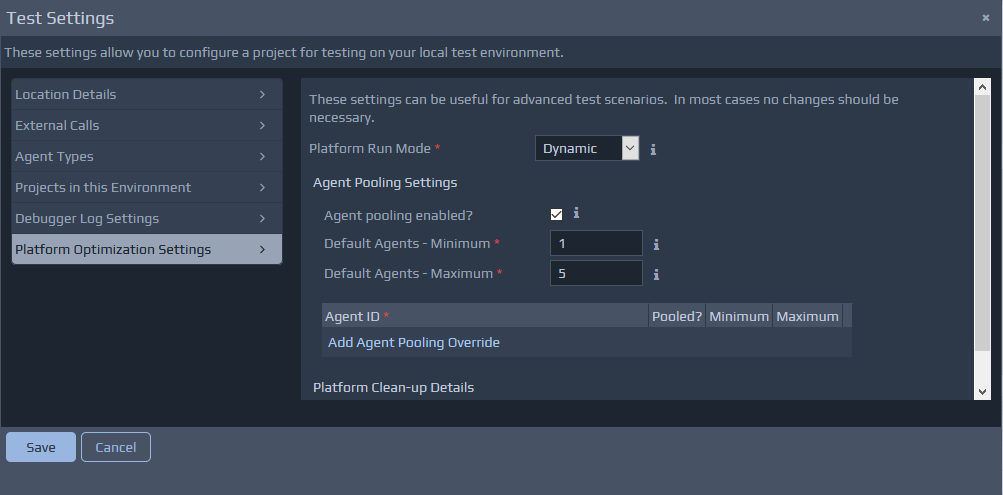 Platform Run Mode - Each application executes on the platform in one of three modes:
Dynamic - This is the recommended mode during development. In this mode, the platform does not cache or reuse any Agent or Asset information. Each Agent and it's corresponding engine instance will be recreated for each request, and any changes to the application specification will be automatically refreshed.
On-demand - In this mode, no Agents are initialised during platform startup. Each Agent is created on first request and cached form then onwards. This can lead to less demand on resources such a system memory, but can be slower for the very first request, compared to the Static mode.
Static - This is generally the recommended mode for production applications. In this mode, the platform will initialise all Agents and corresponding engines when the platform first starts up. Any user requests received will reuse these Agents if they are free. Depending on the pooling settings, more engines may still be created under heavy load. If all engines are currently busy with user requests, and there are no free engines, the requests will be queued until an engine becomes available. The platform will also try to cache assets such as XSLT transforms, XML files, etc., in order to improve performance. This mode yields the best performance, but can be more demanding on system resources such a memory, depending on the settings for Agent Pooling.
Agent Pooling Settings - The pooling section controls how many engines can be maintained for each Agent in the application. These settings are useful for managing concurrent, multi-user applications with large numbers of active users, or for highly variable work loads. There will always be min number of engines available to service user requests, but this may be increased up to the max number, if the load of user requests requires it. Alternatively, engine pooling can be turned off by un-ticking the Agent Pooling enabled?. In this situation, engines will not be maintained, and a new one will be used for each request. This is generally not recommended since it can lead to uncontrolled use of system resources.
One of the major considerations with these settings is the amount of memory on the server to process user requests. The more memory that is available, the higher the level of agent engines that can reside in memory to process user requests. It is difficult to profile these settings in advance, but there is a platform utility that can be used to inspect the server, to obtain information about the agents, engines and assets that are loaded onto the platform at time of inspection. Using URL: http://{server-name}:{port}/{web-application-name}/get_xplatform_info.do an XML document can be obtained in the browser, showing platform usage figures. The information can be used to adjust pooling and clear-down settings. Some further details and considerations can be found on the forum under Performance and Tuning Considerations.
All of these pooling options can be overridden for each Agent in the application as required by adding a pooling override entry. The Agent ids that need to be entered to isolate the Agents for which the overrides are required, can be found within the Debugger log view.
Platform Clean-up Details - You can instruct the WebMaker platform to automatically perform clean-up operations for Agent engines. This can provide better resource utilisation by releasing agent engines that are not being used to process user requests. The Agent clean-up enabled? option is used to instruct the platform to enable or disable engine clean-up. If this option is enabled, the Run Interval should be entered to specify how often the process will run. This value is represented in milliseconds, so a value of 900000indicates a check every
15 minutes (No. of minutes * 60 * 100). As engines are pooled up to the stated maximum during peak loads, there may be the need to clear down pooled engines to release resources once they are no longer being used. This can be managed using the Idle time before removal option. This sets the idle time (in milliseconds) before engines can be removed. Every time the clean-up process is run, all engines that have been idle for the entered time or longer will be removed (subject to the min pooling constraints set for the agent). This value is captured in milliseconds, so a value of
1800000represents a check every
30 minutes (No. of minutes * 60 * 100).